When it comes to getting the message out about Climate change, we need to utilize all methods of communication.
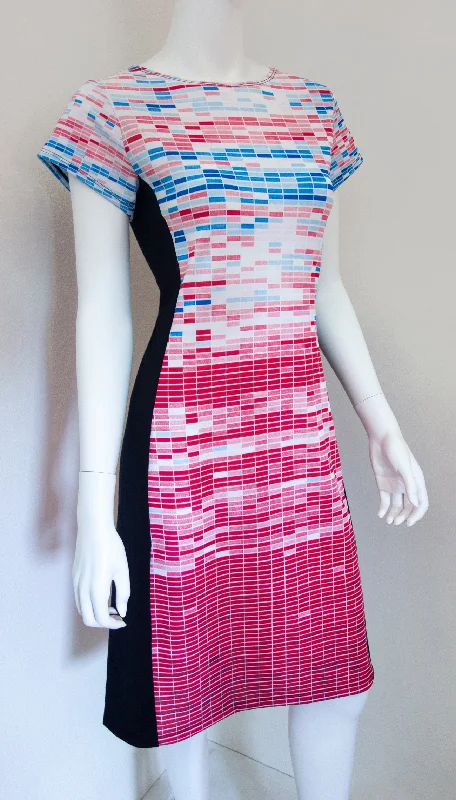
Why not wear science in a dress that not only looks modern and fabulous, but carries a powerful visual message?
This print- is a graphical representation by Climate Central which shows the chain of warm months and how unusual it is. Each colored box represents every month from 1880-2015. The cool, blue months have been slowly disappearing, replaced by red boxes of continuous heat.
This stylish look will be a great invitation to a meaningful conversation at your next conference or social gathering.

